Here we explain how to set up ElasticSearch to read nginx web server logs and write them to ElasticSearch. We use Filebeat to do that.
Filebeat has an nginx module, meaning it is pre-programmed to convert each line of the nginx web server logs to JSON format, which is the format that ElasticSearch requires. Using JSON is what gives ElasticSearch the ability to make it easier to query and analyze such logs.
Note: you could also add ElasticSearch Logstash to this design, but putting that in between FileBeat and Logstash. But that common practice seems redundant here. We will discuss use cases for when you would want to use Logstash in another post.
(This article is part of our ElasticSearch Guide. Use the right-hand menu to navigate.)
What you will need
- nginx web server (or just download the sample shown below and put the into the corresponding folder)
- Filebeat
- Elastic Cloud account (or set up your own server)
- Ubuntu (or other Linux distro). Here we use Ubuntu 16.04.
Set up Elastic Cloud
You can use your own locally-installed instance of ElasticSearch. But here we use Elastic Cloud.
Follow the instructions we wrote here to set up ElasticSearch in the cloud if you don’t already have a system. Note the cloud ID, password, Kibana URL, and Elasticsearch URL as you will need them below.
Install nginx
If you don’t already have a web server you can install Linux or just download some sample nginx files into the /var/log/nginx folder.
sudo apt-get install nginx
Make some Data
If your web server does not have much data, to get a larger amount of log entries change to the nginx log directly and download these two logs:
sudo cd /var/log/nginx
sudo wget http://igm.univ-mlv.fr/~cherrier/download/L1/access.log
wget https://raw.githubusercontent.com/respondcreate/nginx-access-log-frequency/master/example-access.log
Install filebeat
Download filebeats and then install it:
wget https://artifacts.elastic.co/downloads/beats/filebeat/filebeat-7.0.1-amd64.deb
sudo dpkg -i filebeat-7.0.1-amd64.deb
Now enable the nginx filebeat module.
sudo filebeat modules enable nginx
List enabled modules and you will see that nginx is listed.
sudo filebeat modules list
Enabled:
nginx
Disabled:
apache
auditd
elasticsearch
Add the cloud it and your userid and password to the Filebeat config file. This makes it simpler to connect to the instance as it eliminates the need to put IP addresses and ports.
sudo vi /etc/filebeat/filebeat.yml
cloud.id: 'xxxx'
cloud.auth: 'elastic:xxxxx'
Run this command to push nginx dashboards to Kibana. It will start processing logs too.
sudo filebeat setup -e
For subsequent runs of Filebeat run it like this. The -e option will output the logs to stdout.
sudo filebeat -e
Filebeat will process all of the logs in /var/log/nginx. You can verify that by querying ElasticSearch for the indices, replacing the URL below for the URL for you instance of ES.
Note that we have saved the userid:password option in the $pwd environment variable.
curl --user $pwd -X GET 'https://58571402f5464923883e7be42a037917.eu-central-1.aws.cloud.es.io:9243/_cat/indices?v'
The index name will be some combination of the word filebeat and today’s date.
green open filebeat-7.0.1-2019.06.12-000001 baiHMtkcSqO1SojJUW1mVg 1 1 8984 0 6.2mb 3.1mb
Open Kibana
If you have never used Kibana before it will ask you to set up an index pattern. If you have then navigate to the Management screen and add one.
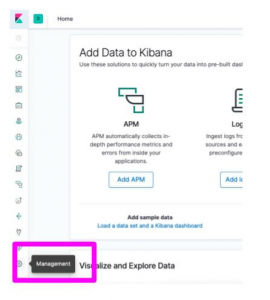
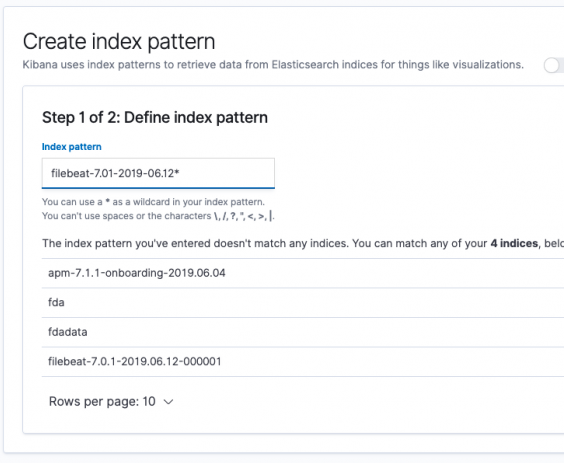
To add an index pattern simply means how many letters of existing indexes you want to match when you do queries. That is, if you put filebeat* it would read all indices that start with the letters filebeat. If you add the date it would read today’s parsed logs. Of course that won’t be useful if you parse other kinds of logs besides nginx. We will illustrate that in another post.
Just start typing the letters f-i-l-e and it will show you which ES document indexes match:
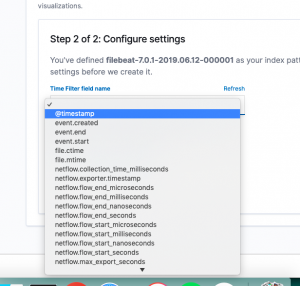
KIbana will ask what field it can use as a timestamp.This is so it can produce a time-series analysis, which is the whole point of gathering logs in the first place. Pick @timestamp for now. It is generated by ES. You can use that when nothing else is in the data itself.
Now, from the Discover screen (i.e., top left button on the nav bar) you can browse records. Kibana will ask you what index pattern you want to use.
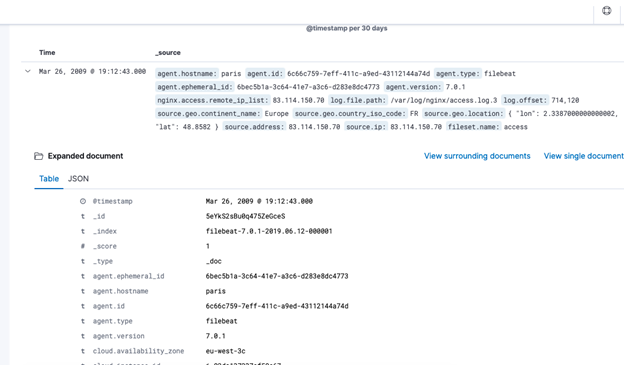
Click on a record to expand it. The record below is too long to see in its entirety. So scroll up and down to see all of it.
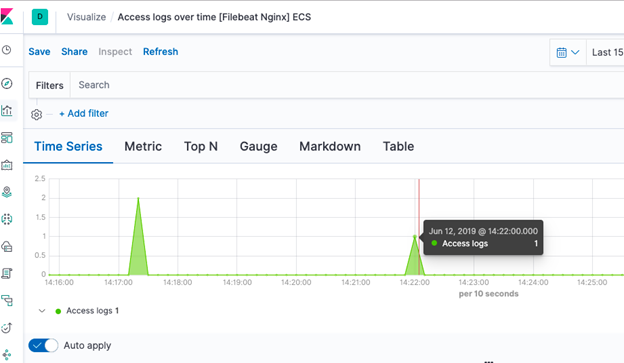
Now click the Visualize screen, again selecting from the nav bar on the left. There are different nginx dashboards that Filbeat already installed. The one below shows website hits over time.
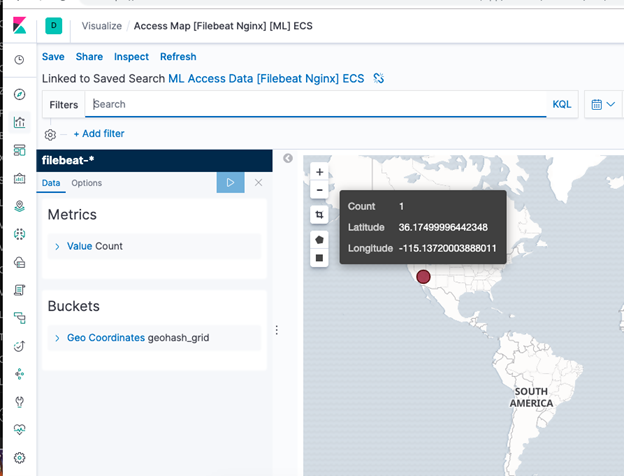
This visualization (aka dashboard) shows the location of the users who have accessed your web site for the time range selected.
