In applied data science, you will usually have missing data. For example, an industrial application with sensors will have sensor data that is missing on certain days.
You have a couple of alternatives to work with missing data. You can:
- Drop the whole row
- Fill the row-column combination with some value
It would not make sense to drop the column as that would throw away that metric for all rows. So, let’s look at how to handle these scenarios.
(This tutorial is part of our Pandas Guide. Use the right-hand menu to navigate.)
NaN means missing data
Missing data is labelled NaN.
Note that np.nan is not equal to Python None. Note also that np.nan is not even to np.nan as np.nan basically means undefined.
Here make a dataframe with 3 columns and 3 rows. The array np.arange(1,4) is copied into each row.
import pandas as pd
import numpy as np
df = pd.DataFrame([np.arange(1,4)],index=['a','b','c'],
columns=["X","Y","Z"])
Results:
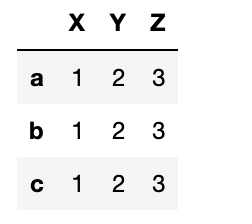
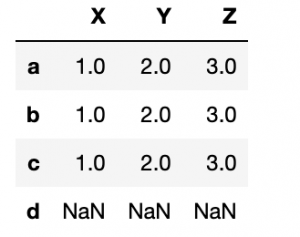
Now reindex this array adding an index d. Since d has no value it is filled with NaN.
df.reindex(index=['a','b','c','d'])
isna
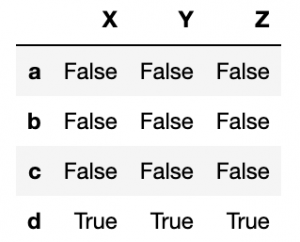
Now use isna to check for missing values.
pd.isna(df)
notna
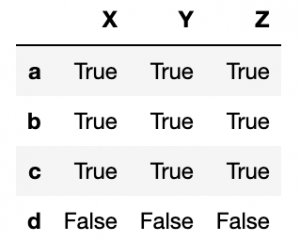
The opposite check—looking for actual values—is notna().
pd.notna(df)
nat
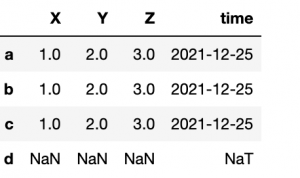
nat means a missing date.
df['time'] = pd.Timestamp('20211225')
df.loc['d'] = np.nan
fillna
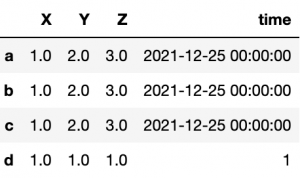
Here we can fill NaN values with the integer 1 using fillna(1). The date column is not changed since the integer 1 is not a date.
df=df.fillna(1)
df['time'].fillna(pd.Timestamp('20221225'))
dropna()
dropna() means to drop rows or columns whose value is empty. Another way to say that is to show only rows or columns that are not empty.
Here we fill row c with NaN:
df = pd.DataFrame([np.arange(1,4)],index=['a','b','c'],
columns=["X","Y","Z"])
df.loc['c']=np.NaN
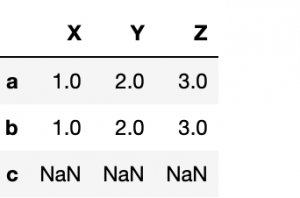
Then run dropna over the row (axis=0) axis.
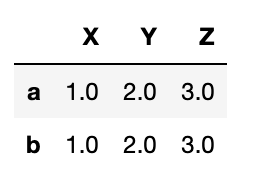
df.dropna()
You could also write:
df.dropna(axis=0)
All rows except c were dropped:
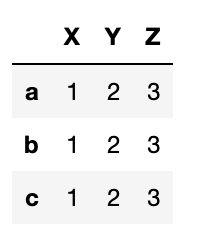
To drop the column:
df = pd.DataFrame([np.arange(1,4)],index=['a','b','c'],
columns=["X","Y","Z"])
df['V']=np.NaN
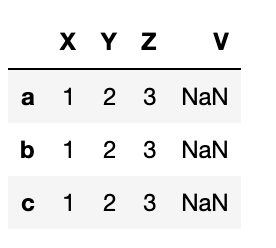
df.dropna(axis=1)
interpolate
Another feature of Pandas is that it will fill in missing values using what is logical.
Consider a time series—let’s say you’re monitoring some machine and on certain days it fails to report. Below it reports on Christmas and every other day that week. Then we reindex the Pandas Series, creating gaps in our timeline.
import pandas as pd
import numpy as np
arr=np.array([1,2,3])
idx=np.array([pd.Timestamp('20211225'),
pd.Timestamp('20211227'),
pd.Timestamp('20211229')])
df = pd.DataFrame(arr,index=idx)
idx=[pd.Timestamp('20211225'),
pd.Timestamp('20211226'),
pd.Timestamp('20211227'),
pd.Timestamp('20211228'),
pd.Timestamp('20211229')]
df=df.reindex(index=idx)
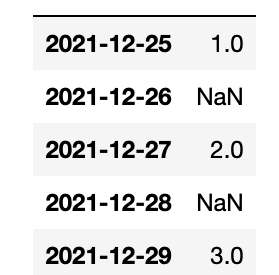
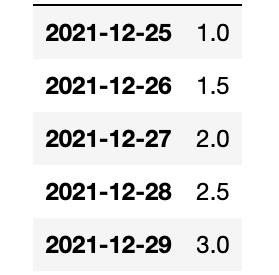
We use the interpolate() function. Pandas fills them in nicely using the midpoints between the points. Of course, if this was curvilinear it would fit a function to that and find the average another way.
df=df.interpolate()
That concludes this tutorial.


